, James M. Minto1
, Jay Warnett2,3
, Katherine J.
Dobson1
, James M. Minto1
, Jay Warnett2,3
, Katherine J.
Dobson1 THE INFLUENCE OF DENSITY DRIVEN MIXING MECHANISMS ON UREOLYSIS INDUCED CARBONATE PRECIPITATION
Philip J. Salter1 , James M. Minto1
, Jay Warnett2,3
, Katherine J.
Dobson1
1Department of Civil & Environmental Engineering, University of Strathclyde, James Weir Building, Glasgow, UK; 2International Manufacturing Centre, WMG, University of Warwick, Coventry, UK; 3NXCT - National Facility for X-ray Computed Tomography, The University of Manchester, Manchester, UK
Correspondence to: Philip J. Salter, Philip.salter@strath.ac.uk How to Cite: Salter, P. J., Minto, J. M., Warnett, J., & Dobson, K. J. The Influence of Density Driven Mixing Mechanisms on Ureolysis Induced Carbonate Precipitation. InterPore Journal, 2(1), IPJ260225–4. https://doi.org/10.69631/ipj.v2i1nr59 RECEIVED: 29 Nov. 2024 PUBLISHED: 26 Feb. 2025 |
ABSTRACT Engineered subsurface barriers with reduced porosity and permeability are critical for safe storage of CO2 and H2, for the prevention of pollutant transport, and for several other subsurface flow challenges. This study investigates enzyme-induced carbonate precipitation (EICP), a promising technique with the potential to achieve uniform precipitation in otherwise inaccessible regions, provided the mechanisms of pore-scale mixing are well understood. High-speed lab x-ray computed tomography and flow modelling were used to study the mechanisms of reagent mixing and precipitation. Our experiments show that initially, crystallization occurs homogeneously across grain surfaces, then localizes in pores with high enzyme concentrations. In these regions, we see crystal growth throughout the 65-minute experiment. Simulation of reagent injection produces a mixing front that matches the distribution of crystals seen in the experiments if we model mixing as a density driven flow. Overall, we see substantial reductions in simulated permeability (11-37%) depending on the efficiency of mixing. Our validated model allows us to predict and propose tailored injection strategies for optimizing mixing, bringing us closer to real-world deployment of EICP for subsurface barriers. KEYWORDS MICP, Microbially induced carbonate precipitation, EICP, Enzyme-induced carbonate precipitation, Permeability, High-speed XCT, Tomography |
|---|---|
@2025 The Authors |
This is an open access article published by InterPore under the terms of the Creative Commons Attribution-NonCommercial-NoDerivatives 4.0 International License (CC BY-NC-ND 4.0) (https://creativecommons.org/licenses/by-nc-nd/4.0/). |
Enzyme induced carbonate precipitation (EICP) is a bio-cementation technique that can be used to seal microfractures and pore throats that are inaccessible to cement and chemical based grouts (27), with many similarities to the better-studied microbially induced carbonate precipitation (MICP). Although EICP has been explored in 2D microfluidic flow cells (10, 28) and various engineering applications—such as soil stabilization and strengthening (3, 21, 22), permeability reduction (31), and hydrocarbon-contaminated sand treatment (25)—it is not yet routinely deployed. This is partly due to a lack of necessary understanding of 3D pore-scale precipitation. We therefore cannot predict, control or exploit the distribution of CaCO3 through time and space using different injection strategies.
Large scale geological sequestration of carbon dioxide (CO2) is an essential component in tackling climate change (12) and we need at least another 10,000 CO2 injection wells globally by 2050 (23). At present there are only 26 projects worldwide, most of which only have CO2 injection/storage to enhance oil recovery. Key challenges preventing more widespread development include the need to prevent CO2 leakage into the atmosphere or groundwater (4), managing injection into heterogeneous natural rocks, and converting existing hydrocarbon extraction systems for CO2 injection and storage. Enzyme induced carbonate precipitation (EICP) is a technique that could be used to create spatially targeted impermeable barriers in the subsurface and seal leakage pathways around wellbores (17), and is therefore a key tool in controlling the injection of and preventing the leakage of geo-sequestered CO2 (and H2).
Enzyme induced carbonate precipitation involves injection of two reagents – a solution of ureolytic enzyme (usually called the enzyme solution; ES) and a solution of urea and calcium (usually called the cementing solution; CS), both of which have low viscosity. On mixing, calcium carbonate precipitates following Equations 1 to 4.
| (1) | |
|---|---|
| (2) | |
| (3) | |
| (4) |
For optimal permeability reduction, an ideal EICP treatment would achieve well mixed fluids and homogenous precipitation of large volumes of CaCO3. By controlling the injection points and the spatial and temporal evolution of the mixing profile in the sample, it should be possible to control where in the sample precipitation occurs, and therefore how the permeability of the sample changes.
To develop effective and deployable EICP strategies, we need experimental data on how mixing occurs within the pore structure, how this mixing influences the timing and location of CaCO₃ precipitation, and a numerical model capable of predicting this behavior in subsurface systems. Previous studies have observed bulk permeability reductions in soil (18) and fractured rocks (20) but have not quantified the spatial and temporal evolution of the precipitation, or the pore-scale distribution of CaCO3, therefore numerical modelling of this system remains challenging and largely unvalidated.
Here we exploit high speed laboratory X-ray computed tomography (XCT) to visualize and quantify the spatial and temporal distribution of CaCO3, capturing precipitation dynamics, flow path migration and the evolving porosity (8, 9, 15). We measure crystal volume and position relative to pore throats and grain contacts, and validate numerical models for permeability, flow velocity and fluid mixing behavior in the pore structure of the experiments. This is carried out with the aim of gaining a fundamental understanding of the EICP process sufficient to design up-scaled injection strategies.
The enzyme solution (ES) was prepared from 12 g/L urease active jack bean meal1, and syringe filtered (<0.45µm) after 30 mins homogenization. Jack bean meal was used as it is 70-90% less expensive and has lower urease activity (1500 U/g) than purified urease sources, allowing a slower reaction rate that has been shown to lead to more compact and harder CaCO3 (6). The cementing solution (CS) was made by dissolving 4M urea and 2.67M calcium chloride in deionized water. The CS pH was adjusted to 6.89 using 4M HCl prior to injection to delay the immediate onset of precipitation (after 5, 16).
Custom made 3D-printed (5 mm diameter, 0.39 cm3 volume) flow cells (Fig. 1) were filled with quartz sand (Sigma Aldrich, silica content ≤100%, particle size range of 210 - 297 µm), with a porosity of 39%. The columns were saturated with a 3 g/L NaCl solution to simulate a subsurface brine and mounted into a Tescan UniTOM XL lab scanner (University of Warwick, WMG). A total of 1.5mL each of CS and ES were simultaneously injected through the two inlet ports (Fig. 1) at a combined flow rate of 1.0 mL/min, corresponding to approximately 6 pore volumes/min. The ES entered the sample at a single central feed point surrounded by the 4 CS feed points (Fig. 1b). After 3 minutes of injection (equivalent to 18 pore volumes), the flow was stopped, and XCT data were collected.
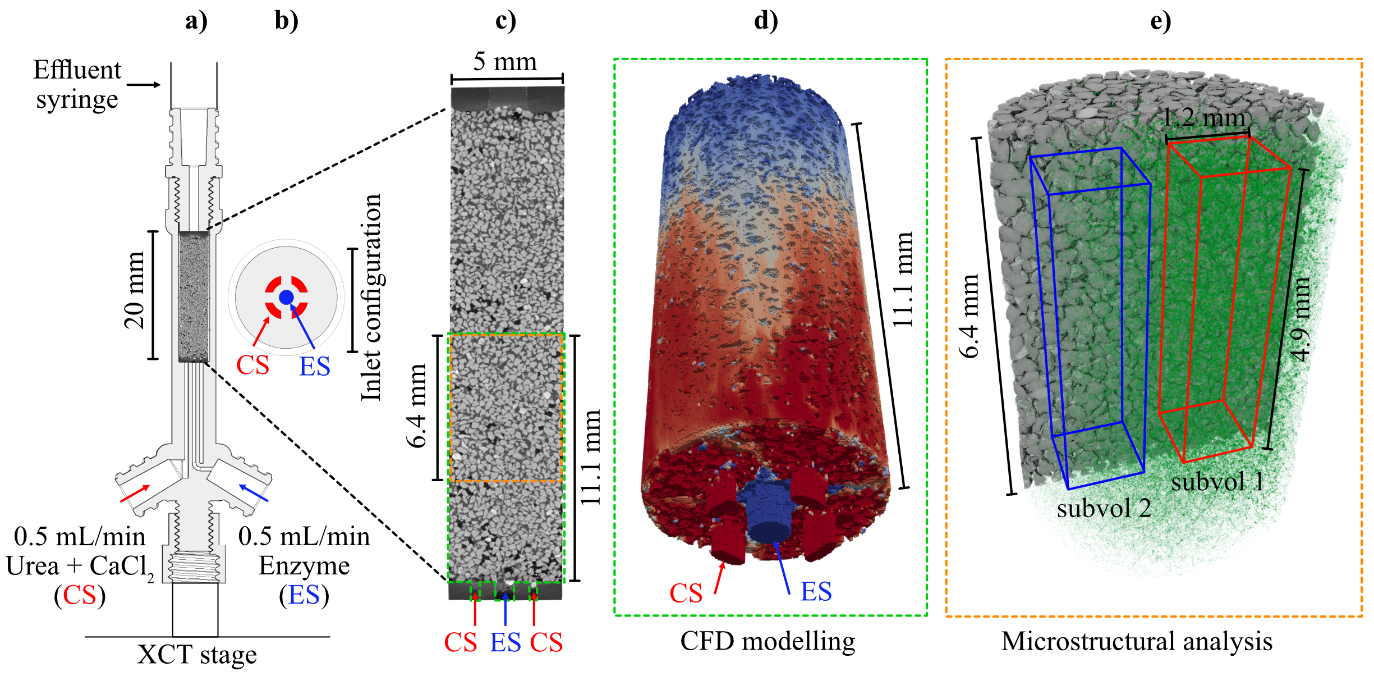
Figure 1: Experimental setup, analysis and modelling: a) 3D printed flow cell, b) inlet configuration showing urea/calcium chloride (red) and enzyme (blue) entry points, c) vertical slice through entire sand pack volume, d) 3D rendering of CFD modelling volume, and e) imaging window captured during sequential scans showing sub-volume 1 (red), sub-volume 2 (blue)
All XCT data were collected at 40kV and 15W/375 µA, with 1440 projections/scan (205 ms exposure time). Twelve scans were acquired over a 1-hour period with each scan lasting 5 minutes. Each scan began immediately after the previous one was completed. Crystal growth was continuous over the scanning period so there will be a difference in the sample structure at projection 1 and at projection 1440. This difference will mean some blurring of the data. A time period of 5 minutes per scan ensured this difference was minimized and that scans could be reconstructed with minimal blurring artefacts, while still seeing CaCO3 growth that was measurable. The proprietary Tescan reconstruction code generated 3D datasets with 8.156 µm resolution (voxel edge length). Image processing and analysis were completed in Avizo®2 and the full workflow is shown in Appendix Figure A1 (available online).
The sample remained stationary between scans; however, to ensure precise spatial alignment over time, the data were registered (26) and an edge-preserving denoising anisotropic diffusion filter (2) was applied. A post reconstruction beam-hardening correction was also applied to each dataset. Segmentation was performed using the histogram-based Auto Thresholding module in Avizo (19) to minimize human bias when processing datasets with bulk greyscale values that change over time due to precipitation (App. Fig. A1, available online). The binary map of the pore phase generated through segmentation was inverted to produce a binary map of the solid phases. The similarity of the attenuation (greyscale) prevented the segmentation of the CaCO3 from the quartz. The quartz does not change through time and there is no CaCO3 at t=0. The CaCO3 volume was calculated by subtracting the t=0 scan (quartz only) from the segmented quartz + CaCO3 in later scans (Fig. 2). The porosity was determined by calculating the volume fraction of the non-solid phase relative to the entire cylinder volume.
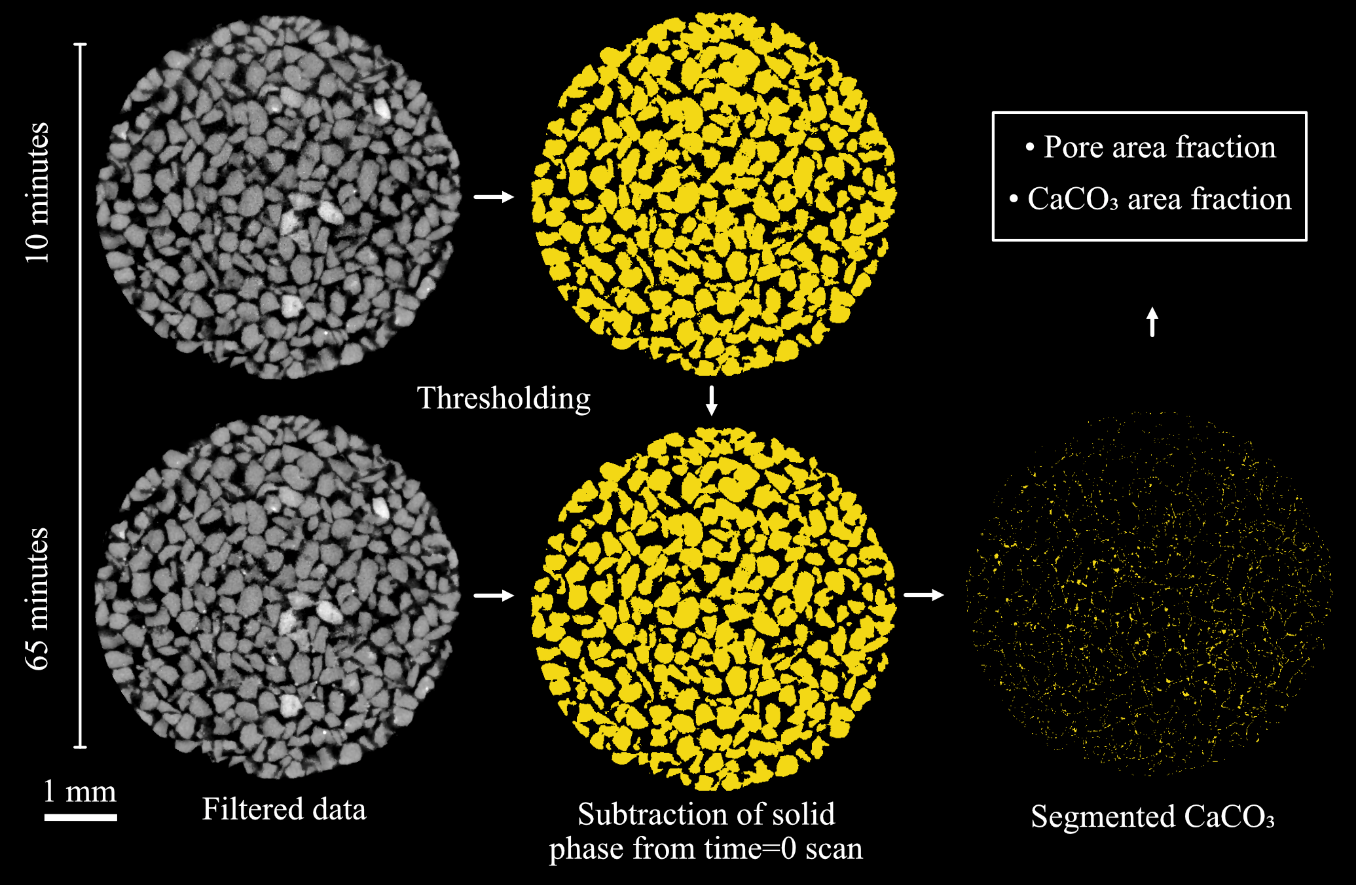
Figure 2: Segmentation of solid phases and calculation of CaCO3 by subtraction of t=0 (quartz only) from t=n (quartz + CaCO3).
The volumes and positions of the crystals were measured from the binary maps of CaCO3. We use the term “crystal” to refer to each individual object in the binary map, though some may actually be crystal clusters that would only be distinguishable at higher resolution.
The pore network morphology was determined at t=0 using a separation based on a Random Walk Distance Map (1). Pore volume, geometry and coordination numbers were measured for each pore, and pore throat locations were identified. While the sand grains remain stationary, precipitation alters the volume and geometry of the pores, which could potentially change the number and location of pore throats. We therefore use the pore throats defined at t=0 for all t≠0 datasets, applying the segmented t≠0 pore network as a mask to the t=0 separated 3D pore map (see Figure A1, available online). Mapping these properties over time onto a consistent geometry enables the quantification of volume and geometry changes at the pore scale. The location, area, and geometry of the pore throats at t=0 were extracted from the Local H-Maxima output (see Fig. A1 in the Supplementary Material, available online). The distance from every point within the pore network to the nearest throat was then calculated using a Distance Map. The distance of each CaCO3 crystal to the nearest pore throat was then extracted through Label Analysis applied to the distance map output, masked by the 3D CaCO3 location map (See Fig. A1 in the Supplementary Materials for details, available online). At each time point, the permeability of the pore network was calculated using the Absolute Permeability Simulation available within the XLab Simulation package of Avizo.
A second Random Walk Distance Map was applied to the inverted pore network at t=0, and the volume, surface area, sphericity, and coordination number (i.e. number of solid-solid contact points) of the quartz grains were measured using a Label Analysis.
By integrating the pore geometry and CaCO3 3D location maps with the permeability simulation outputs, we can determine the mean velocity of flow in each pore, through each pore throat, and at each crystal location during the initial injection phase (Fig. 3). Pore and CaCO3 analysis and Absolute Permeability Simulations were also performed on two smaller sub-volumes selected from different regions of the sample (Fig. 1).
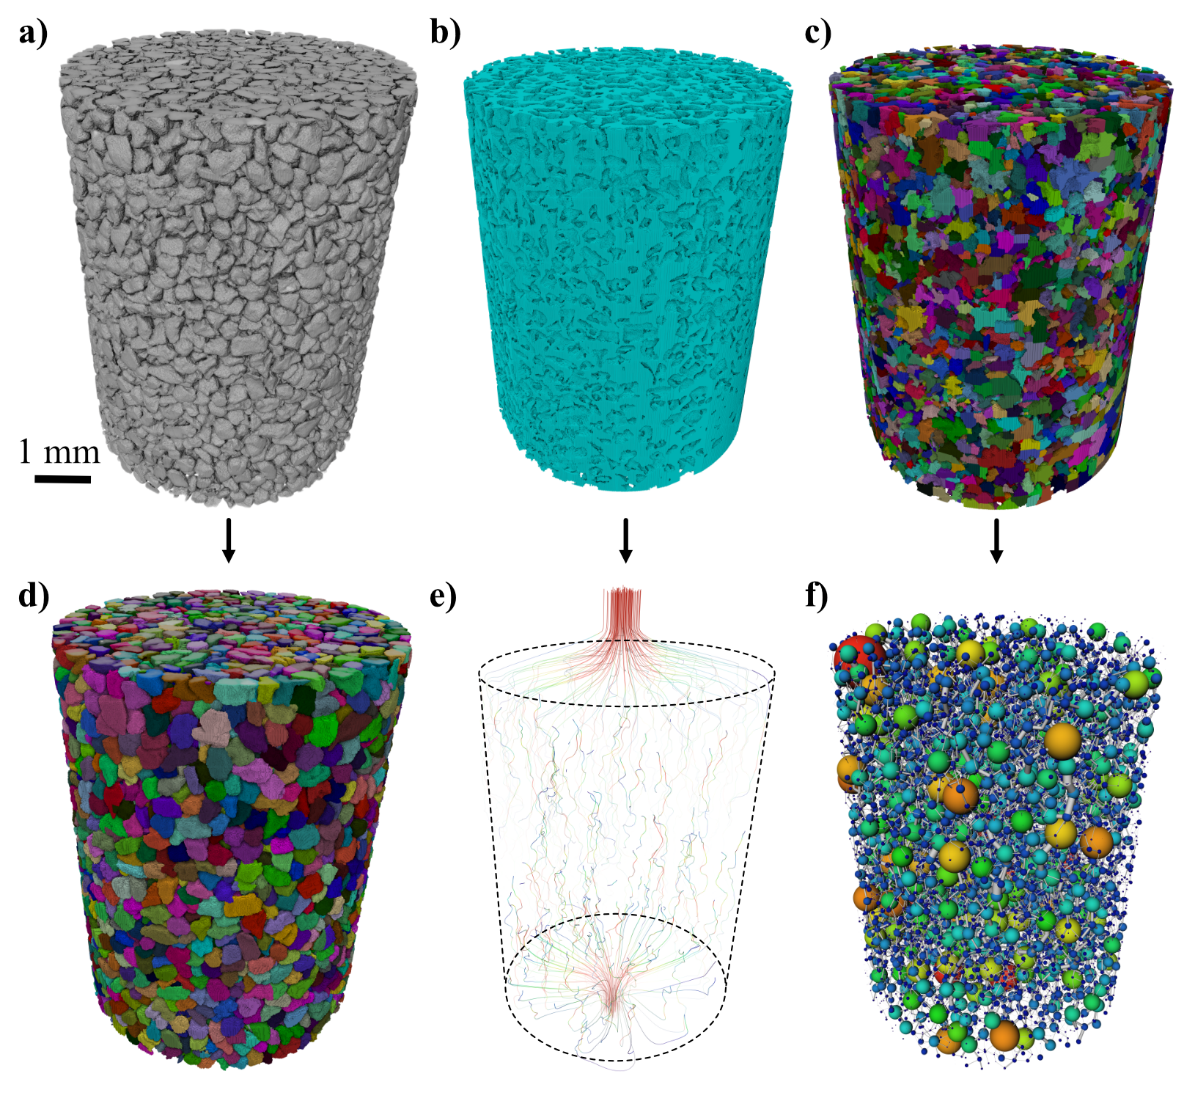
Figure 3: 4D
Image processing workflow: a) binarized solid regions,
b) connected pore space,
c) separated pores by random walk distance map,
d) separated grains, e) output
streamlines from absolute permeability simulation, and
f) pore network model.
The small volume of the CaCO3 crystals, ranging from 542 µm3 (a single voxel) to 4.5x108 µm3 (mean = 6766 µm3), along with the common formation of crystal clusters, is the primary source of uncertainty in the quantitative data. The partial volume effect comes from defining any irregular particle as a group of voxels. The greyscale values of voxels that intersect the surface of the particle will be proportional to the relative volume of the particle and the surrounding media within the voxel. As the segmentation process will include or exclude a voxel based on that greyscale value, the binarized (segmented) data will locally (at the voxel scale) over or underestimate the location of the particle surface. For CaCO3 crystal clusters, this may be further complicated as the internal voxels can have both particle and pore fluid within them. The value of the uncertainty on any individual particle and any particle population can be calculated (14). The pores and sand grains are all large relative to the voxel size (mean volume of 4180 and 18200 voxels respectively), thus the uncertainty cannot be seen when plotted on the size distributions.
Another potential source of uncertainty is the combination of spatial and temporal resolution. While we observed no evidence of crystal motion during the experiment, nor of nucleation and growth away from the sand grain surfaces, the resolution of the images may prevent the capture of very small crystals. However, crystals are observed to form on all sides of sand grains with no clear preference for the upper surface, suggesting that nucleation primarily occurs directly on the grain surfaces rather than in the solution, followed by settling on the tops of grains. Each 3D acquisition takes 4 minutes and 55 seconds, with a new scan started every 5 minutes. As a result, data reconstruction could be affected by changes in CaCO3 volume during a scan. However, we can see measurable differences in crystal volume between time points and find minimal blurring artefacts in the data, suggesting that individual datasets are significantly impacted by crystal growth. We therefore assume that any effect is captured in the partial volume effect in the reconstructed data.
Fluid mixing was simulated using the computational fluid dynamics software OpenFOAM, with a domain extending from the inlet to the top of the dynamic imaging window (Fig. 1). The injection parameters were designed to replicate experimental conditions, where the four outer inlets injected CS (density = 1234 kg/m3, viscosity = 2.1157×10⁻⁶ Pa∙s), while one central inlet injected ES (density = 998 kg/m3, viscosity = 1×10⁻⁶ Pa∙s). The mesh was generated from a full sample scan with a voxel edge length of 13.768 µm; however, this resolution was computationally prohibitive for dynamic flow simulations. Down-sampling by a factor of 2 resulted in a voxel edge length of 27.536 µm, which balanced computational efficiency with sufficient resolution to capture flow behavior while enabling feasible simulation times. A mesh independence verification was conducted by comparing Absolute Permeability Simulations for the original (13.768 µm) and down-sampled (27.536 µm) meshes. The sensitivity analysis on permeability showed that while down-sampling altered the simulated permeability value by 18%, it did not significantly affect flow path dynamics (Appendix Fig. A2, available online). The code used to convert voxel data into a mesh readable by OpenFOAM, with appropriate boundary patches, was written as an ImageJ script implemented in Fiji (24), following the methodology outlined in Section 3.5 of Willems et al. (29).
The twoLiquidMixingFoam solver within OpenFOAM was used to model injection and subsequent density-driven flow of the miscible ES and CS. The solver employed second-order spatial discretization schemes for key terms, ensuring accurate representation of flow dynamics. Temporal discretization was handled using the first-order implicit Euler method for stability in transient simulations. A detailed list of parameter settings and schemes is provided in Table A1 (Appendix A, available online).
The focus was placed on adjusting density and viscosity parameters, as these were critical for capturing mixing behavior, while all other parameters were retained from the validated twoLiquidMixingFoam tutorial. The post-injection flow phase was also modelled to account for the density-driven mixing during crystal formation.
RESULTS
Data were collected across 12 time points during crystallization (no injection). The sensitivity analysis on permeability showed that while down-sampling did alter the simulated permeability value (18%), it did not significantly alter flow path dynamics (Appendix Fig. A2, available online). The injection points are lower than the imaging window (Fig. 1) and it was therefore anticipated, due to the miscibility of the two fluids, that sufficient mixing would have occurred beneath this to promote uniform crystallization across the imaging region. The simulated permeability across the red sub-volume 1, where ~5% CaCO3 eventually formed, is reduced much more rapidly than the blue sub-volume 2 or the whole domain.
Figure 4 summarizes the simulated permeability and volume fraction of CaCO₃ for the full imaging volume and sub-volumes 1 and 2 at 20, 35, 50 and 65 minutes, highlighting the localized effects of CaCO₃ precipitation on hydraulic properties.
During the first 20 minutes of the reaction, the vertical distribution of CaCO3 is relatively homogenous. However, as the reaction progresses, the volume fraction of CaCO3 increases gradually from inlet to outlet (Fig. 5). Once nucleated, the crystals formed in the lower portion of the column (<5 mm) showed minimal volume increase over time, while those formed towards the outlet continue to grow. To quantify porosity evolution along the flow direction, we plotted the 2D percentage of CaCO3 from the base of the imaging region (near-inlet) to its top (Fig. 5).
| a) | 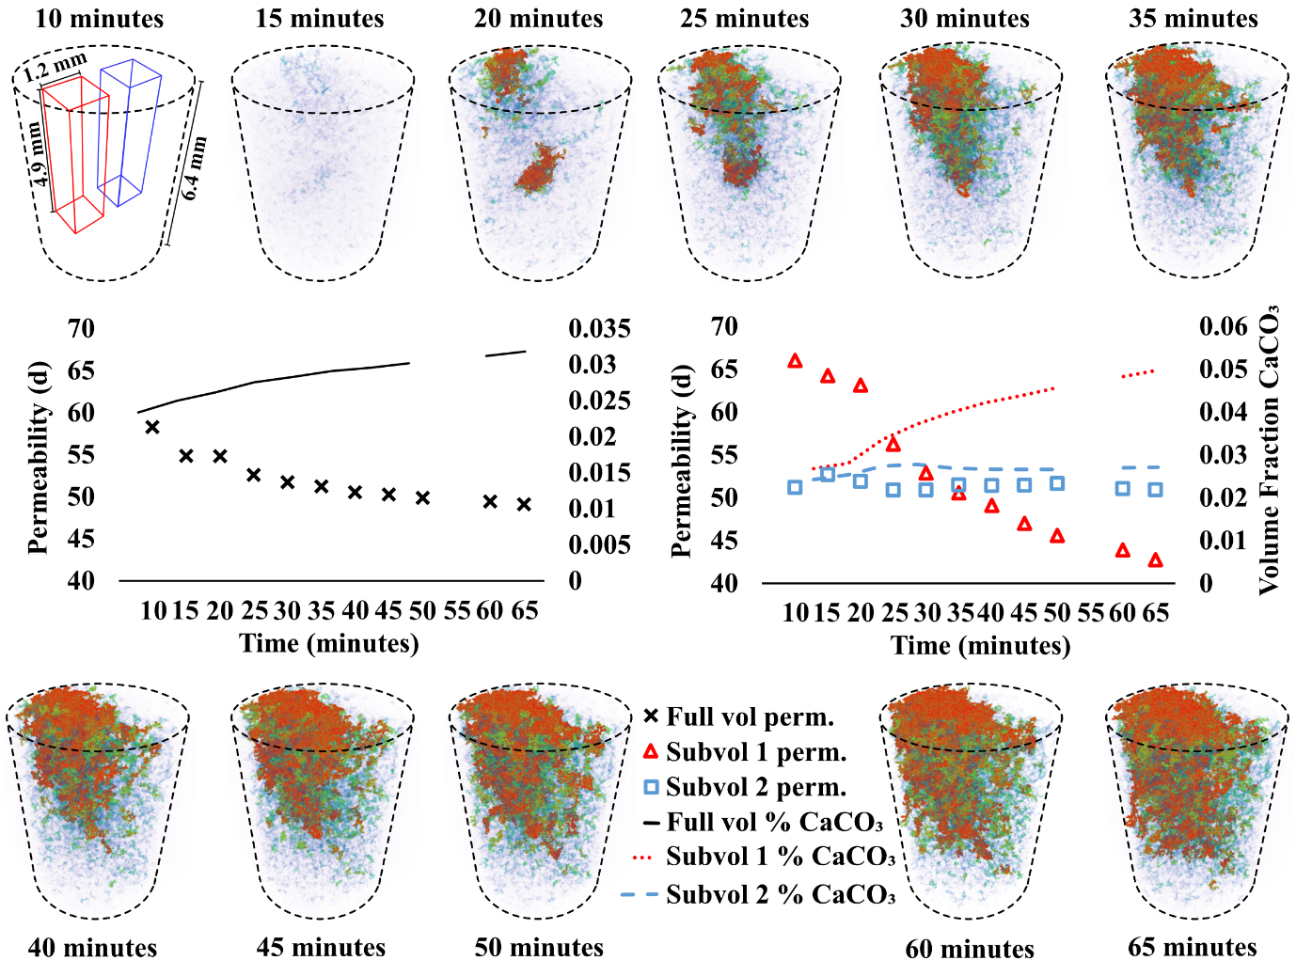 |
|||||||||||||||||||||||||||||||||||||||||||
|---|---|---|---|---|---|---|---|---|---|---|---|---|---|---|---|---|---|---|---|---|---|---|---|---|---|---|---|---|---|---|---|---|---|---|---|---|---|---|---|---|---|---|---|---|
| b) | ||||||||||||||||||||||||||||||||||||||||||||
| c) | ||||||||||||||||||||||||||||||||||||||||||||
|
||||||||||||||||||||||||||||||||||||||||||||
| Figure 4: CaCO3 precipitation over time: a) Spatial distribution of CaCO3 over time with crystals colored with red representing the largest and blue the smallest volumes. b) Graph of permeability/time/volumetric % CaCO3 for the full volume (black), highly precipitated sub-volume 1 (red), and low precipitation sub-volume 2 (blue). c) Simulated Permeability and Vol. Fraction CaCO₃ for the Full Volume and Sub-volumes at Selected Time Points During EICP. | ||||||||||||||||||||||||||||||||||||||||||||
While the evolution of CaCO3 distribution is explored relative to column height in Figure 5a, the 3D distribution of CaCO3 can be more effectively visualized by plotting the average radial and axial concentration for each individual pixel (Fig. 5b). The main precipitation zone forms a cone-like shape, with the highest concentrations of CaCO3 occurring centrally and towards the outlet. The position of precipitated CaCO3 relative to quartz grain surfaces, as determined by random walk distance map, is explored in Figure 6.
| a) |
|---|
| b) |
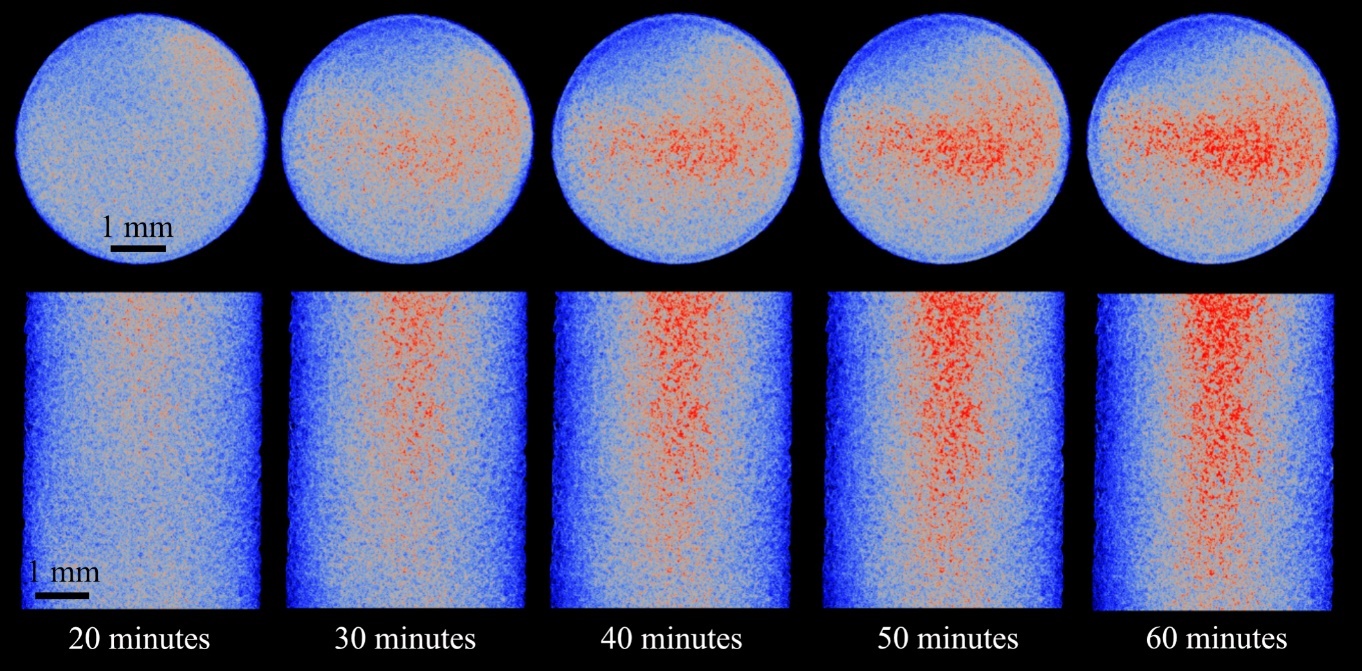 |
| Figure 5: Distribution of CaCO3 over time with: a) Column depth - The inset images are at 65 minutes and approximately 0.4mm (left) and 6.1mm (right) from the bottom of the dynamic imaging window with CaCO3 colored red, b) radial and axial CaCO3 distribution (red) over time. |
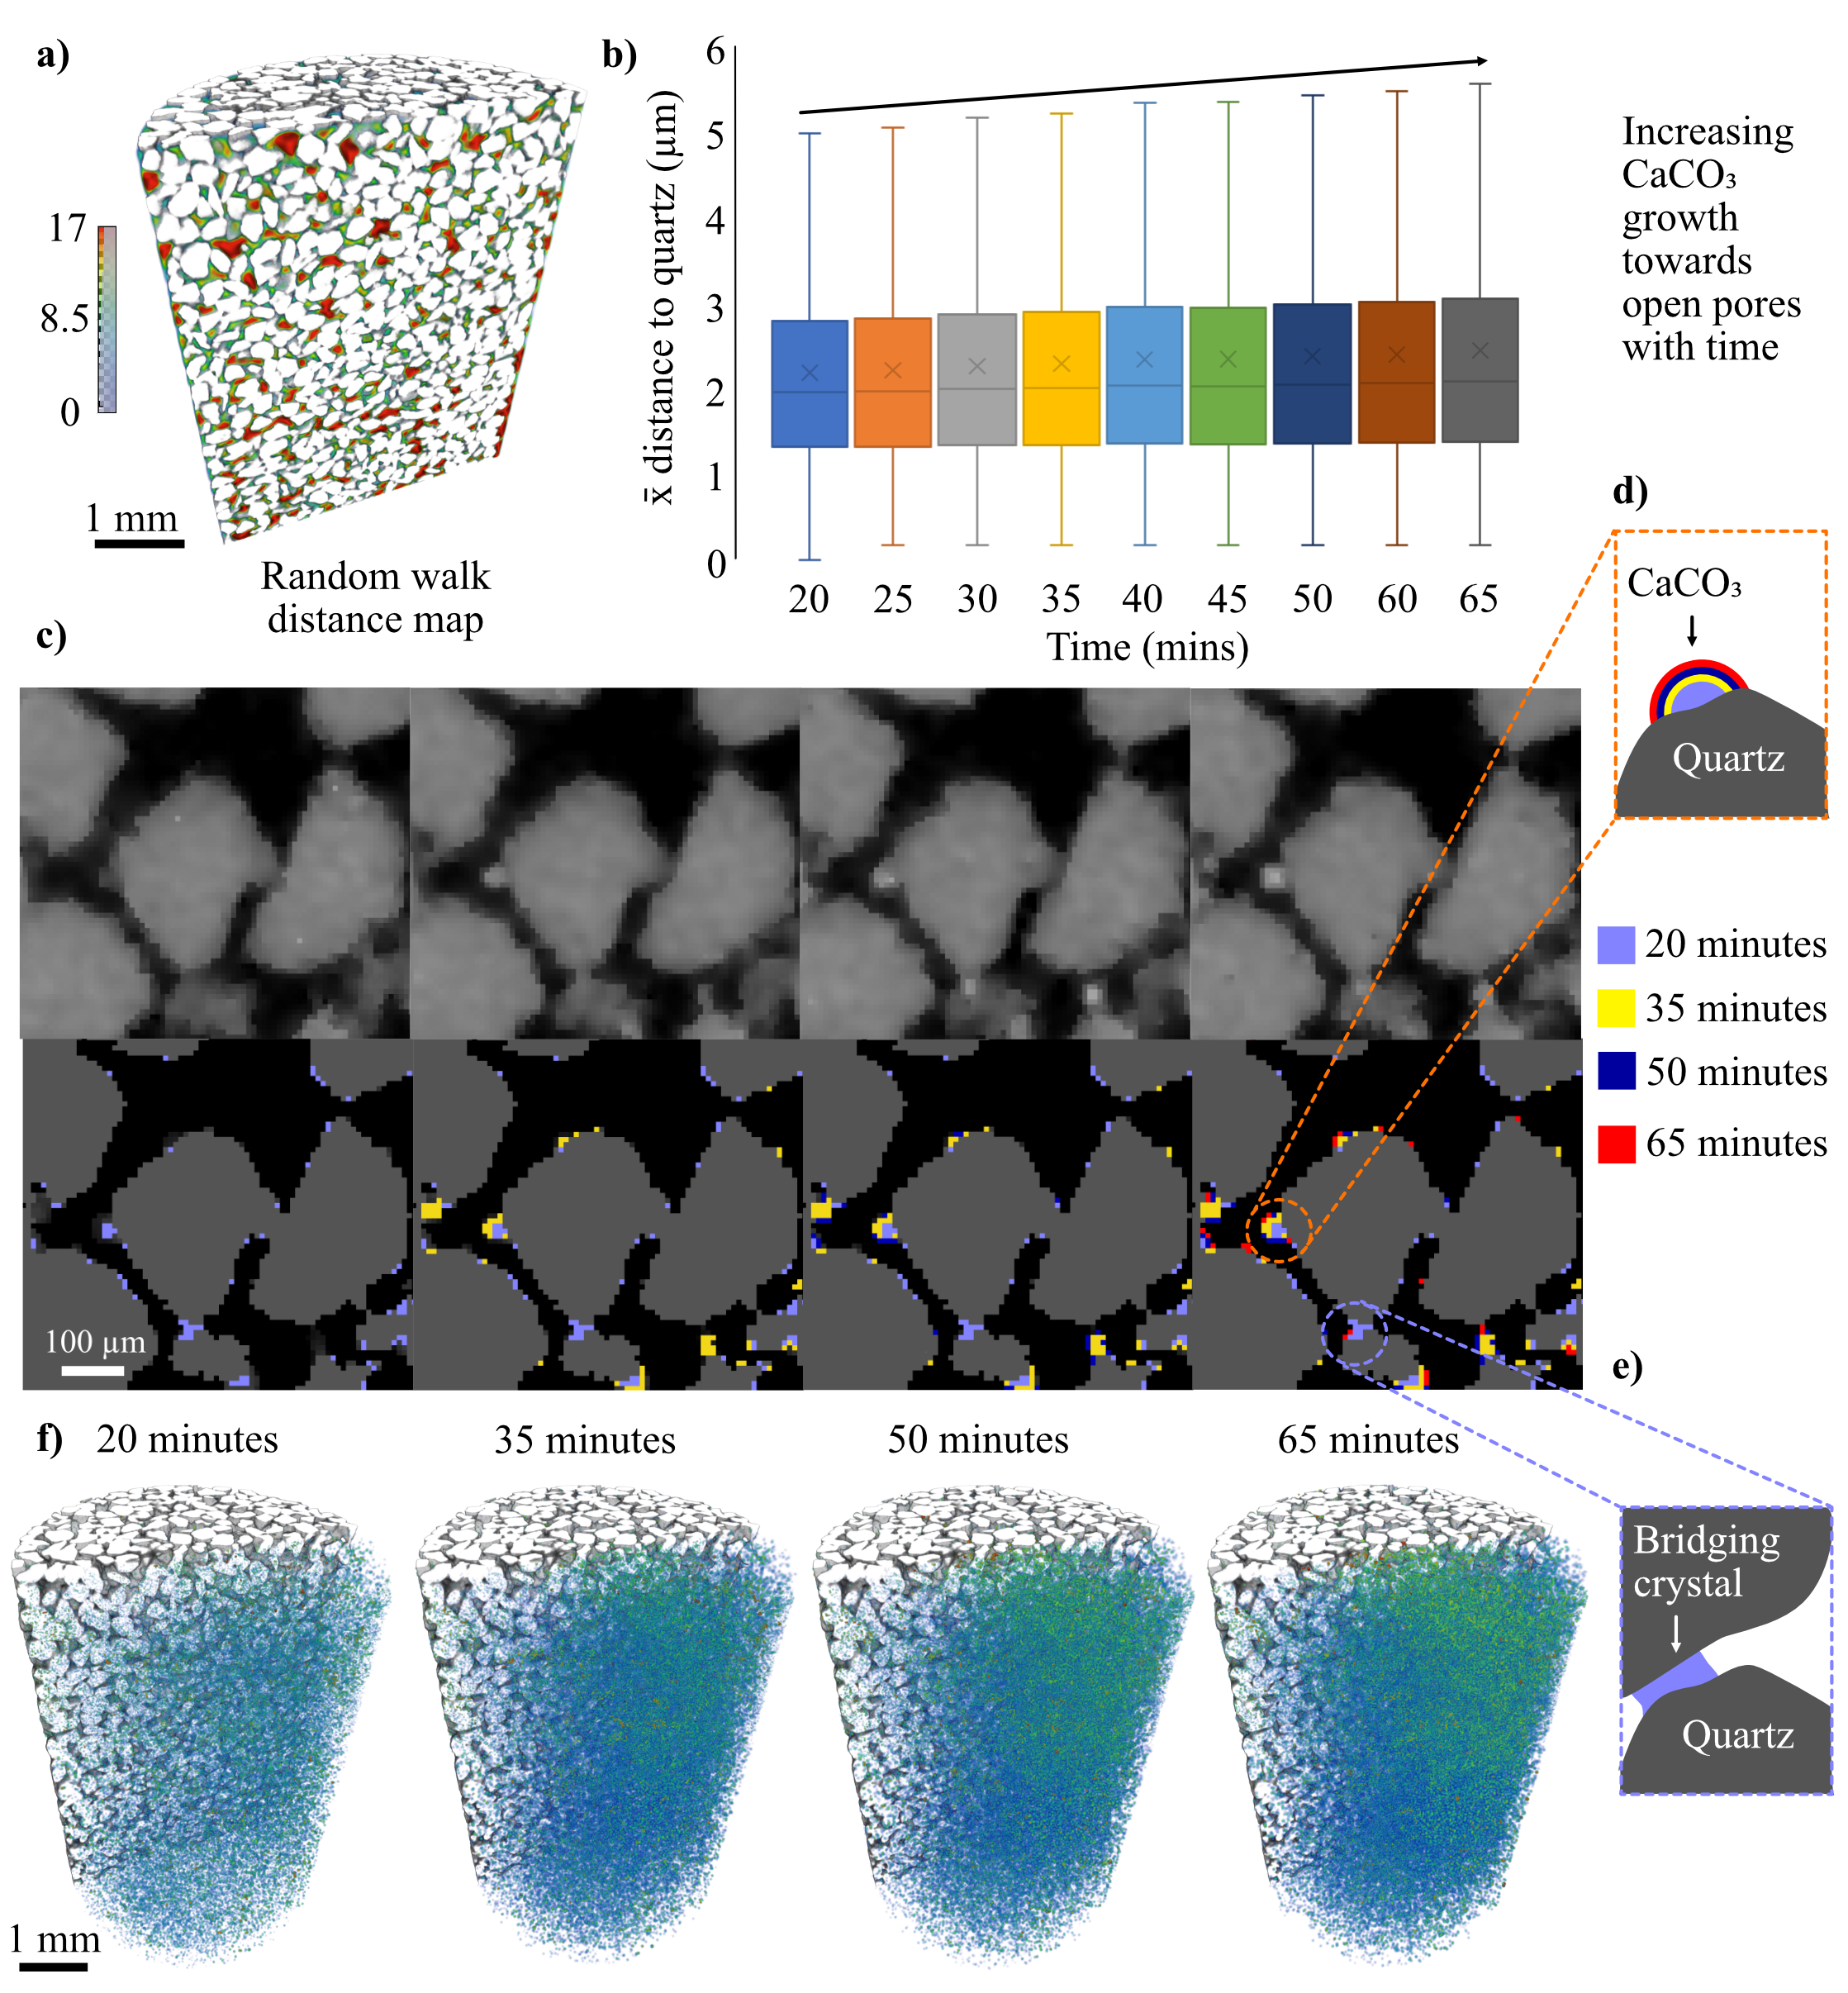
Unlike MICP, where cells tend to attach at grain contact points before acting as nucleation sites for crystal growth (i.e. the solution immediately around them becomes supersaturated with respect CaCO3) (16), we observe many small crystals nucleating throughout the column, before growing out into open pores on existing CaCO3 (Fig. 6f). This precipitation mechanism (schematically represented in Fig. 6d) appears to be more dominant than CaCO3 growth at grain contact points (Fig. 6e). The mean distance map values for CaCO3 that then forms between scans (Fig. 6b) shows a subtle upward trend in crystals growing towards open pores over time rather than continued grain surface growth. By coloring CaCO3 crystals by their mean distance map value (Fig. 6f) we see that the crystals that grow towards open pores (i.e. warmer colors) are primarily found within the main precipitation band. The continued growth in this region is therefore on pre-existing CaCO3.
 |
|---|
| Figure 6: Crystal locations relative to quartz grain surfaces as determined by random walk distance map. a) Random walk distance map with near grain surfaces colored blue and open pores (red). B) Box plots of the mean distance of new CaCO3 (grown between scans) to quartz grain surfaces for each time point. c) Zoomed in view of XCT data showing how crystals form over time. Schematic of CaCO3 growth into d) open pores and e) grain contact points. f) Crystals colored by distance map value over time with coloring as per (a). |
Absolute permeability refers to the ability of a porous material to transmit a single-phase fluid and is characterized by a constant coefficient that relates fluid flow and material parameters in Darcy's law (Eq. 5):
| (5) |
|---|
Where the global flow rate that goes through the porous medium is
represented by , which is measured in units of
m3/s. The cross-sectional area of the sample through which
the fluid flows is represented by
and is measured in m2. The
dynamic viscosity of the fluid flowing through the sample is represented
by
and is measured in Pa∙s. The pressure
difference applied across the sample is represented by
and is measured
in units of Pa.
represents the length of the sample in
the direction of flow and is measured in m. Permeability,
with units in m2, is
therefore a function of the pore geometry and connectivity within the
sample, and a bulk value of permeability can be obtained for the entire
sample by experimentally measuring the pressure drop for a given flow
rate, as is typically done for cylindrical cores in a core holder.
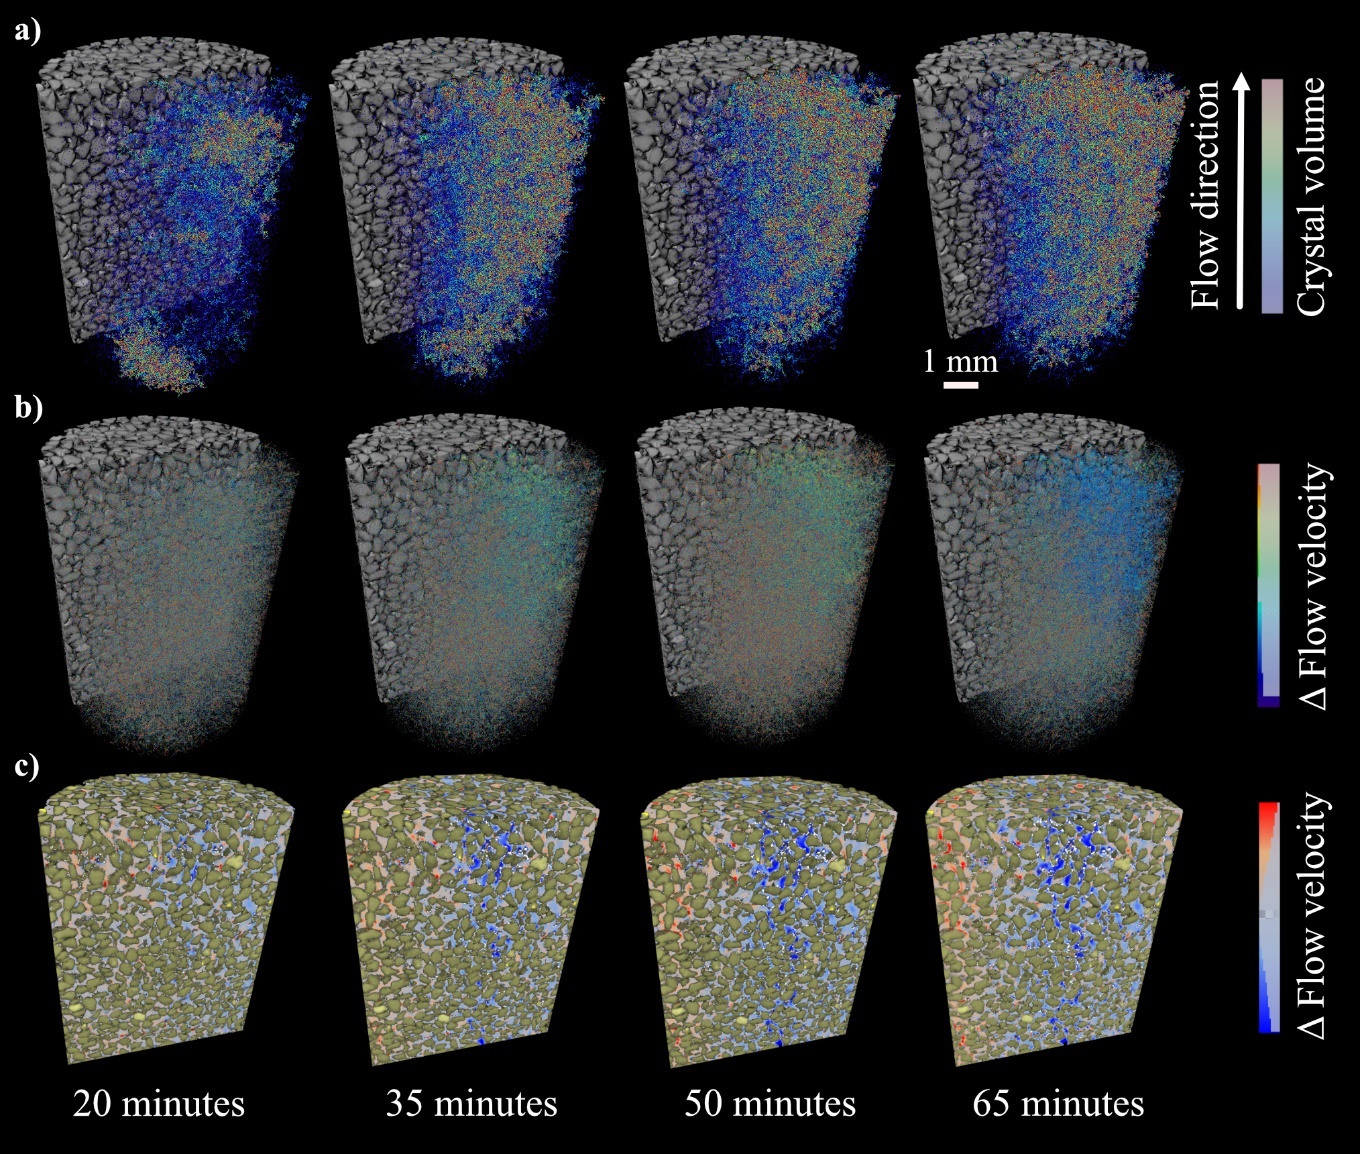
Figure 7: The effect of enzyme induced CaCO3 on flow: a) crystals are colored by volume, b) their effect on simulated flow velocity relative to t=0 and, c) with crystals colored white, and pore space colored by the flow velocity at t≠0 minus the flow velocity at t=0 from flow simulations.
Permeability can also be estimated numerically based on XCT derived pore geometry and connectivity together with simulated fluid flow and pressure drop across samples of any shape or size without limitations imposed by the core holder design or pressure sensor resolution. In this study, the Avizo XLab Simulation module was used for the determination of the absolute permeability with the added benefits that flow paths are also calculated and, rather than a single bulk measure of permeability, multiple permeabilities can be calculated for different regions of the sample.
In addition to simulation of the initial (pre-EICP) pore geometry, permeabilities were also calculated at different time points during the static EICP reaction period to understand how the precipitating CaCO3 and evolving pore geometry were shaping the hydraulic properties. The results of permeability/porosity and permeability/time calculations are shown in Figure 4.
By running absolute permeability simulations at each time point, the output velocity field can be used to visualize and quantify the effect that each individual crystal would have on flow at that particular instance in time (Fig. 7).
The location of the extracted sub-volumes is shown in the Figure 1e. While the initial permeability of sub-volume 1 (61.4 Darcy) is higher than that of sub-volume 2 (46.4 Darcy), it experiences a 37.1% reduction in simulated permeability over the course of the experiment. There is a negligible (0.8%) reduction in permeability within the blue sub-volume 2. The full imaging volume experiences an intermediate reduction (11.4%) as a result of both regions. Flow is diverted to the column's peripheries as crystals form in the central region, shown by the red areas of the pore space in Figure 7c at 65 minutes. We hypothesize that ES and CS were mixed sufficiently within sub-volume 1 to induce rapid CaCO3 precipitation and the altering of flow paths (Fig. 8), but that fluid mixing was limited within sub-volume 2, resulting in less precipitation. This is explored further in Section 3.3.1.
Overall, these observations suggest that the impact of EICP on porosity and permeability in sand is highly dependent on the spatial distribution of CaCO3. As expected, regions with high crystal growth experience a greater reduction in permeability compared to regions with minimal crystal growth.
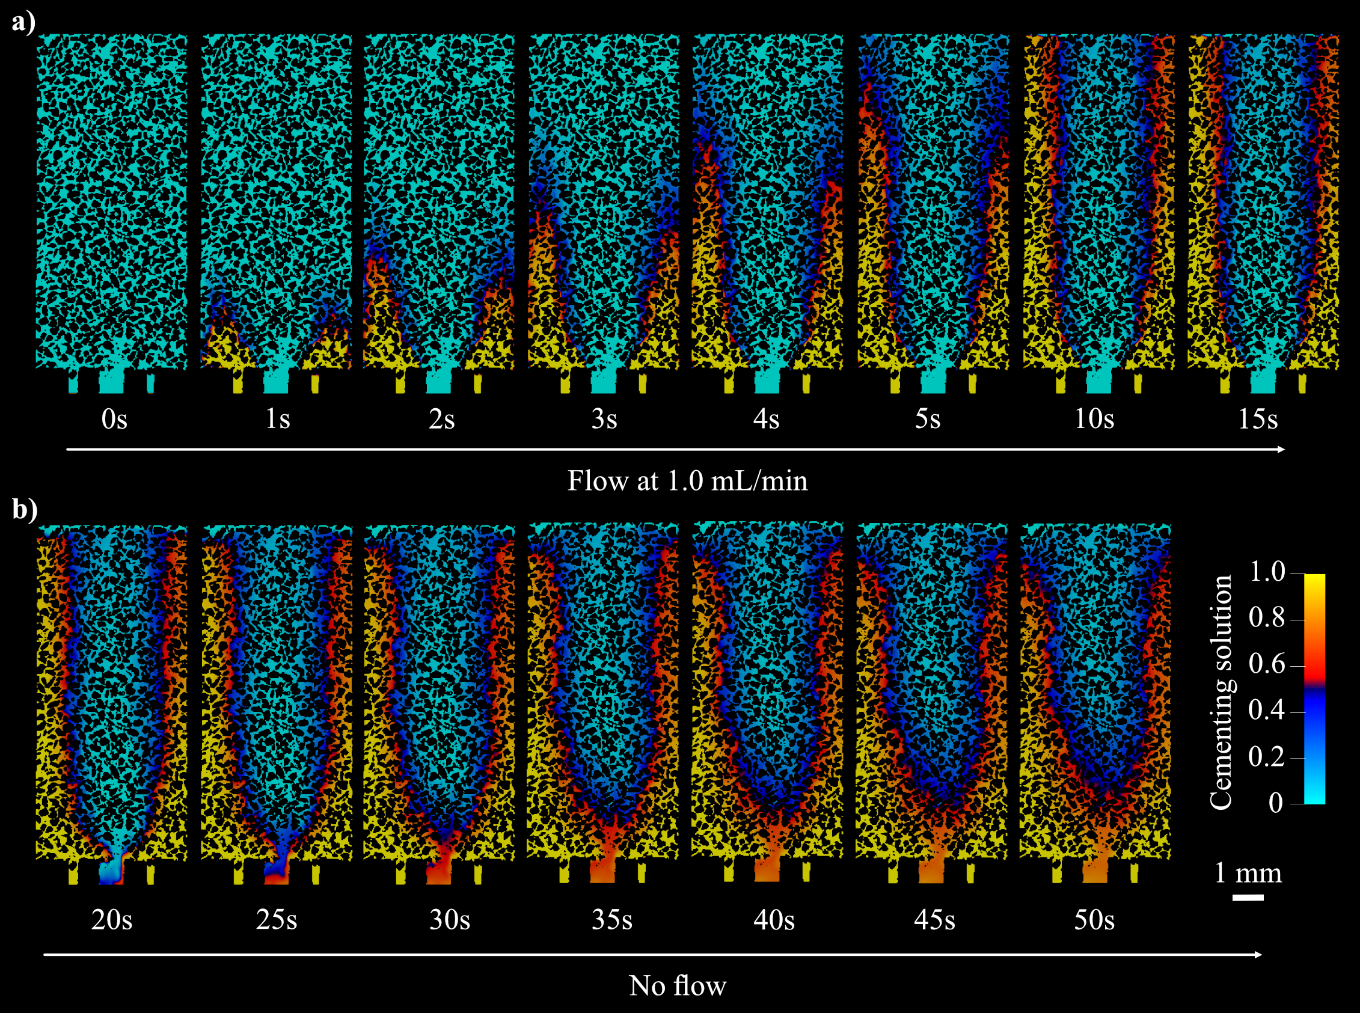
Figure 9: Cross sectional view of enzyme and cementing solution mixing during a) flow of 15s, at which point the injection reaches a steady state, and b) the static period when crystallization occurred.
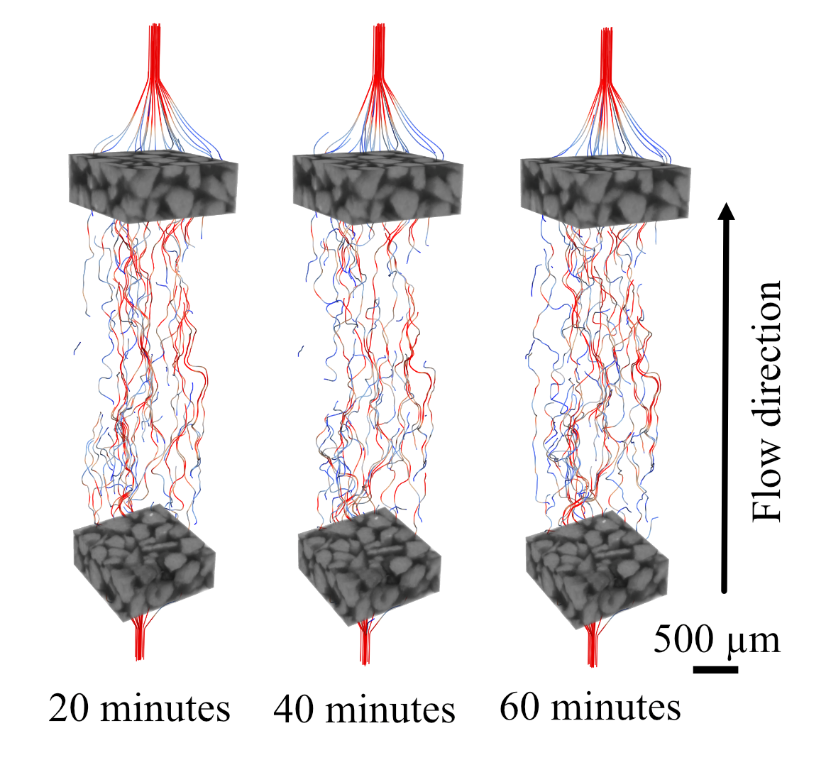
Figure 8: Streamlines of flow paths across high precipitation sub-volume 1 over time.
The distinctive cone-shaped crystal region can be better understood by simulating the mixing of CS and ES within the sample. We also simulate the fluid behavior after flow cessation during imaging. Three mechanisms hinder uniform mixing in the pore space. First, the smaller cross-sectional area of the central inlet (0.486 mm2), used for injecting ES, compared to the four outer inlets (0.760 mm2) used for CS injection, results in a higher flow velocity. This leads to an initial cone-like geometry of the enzyme fluid field (Fig. 9a). Second, the higher kinematic viscosity of CS physically inhibits further mixing. Third, when flow stops, density-driven currents cause CS to settle at the lower part of the sample, reducing the available surface area for diffusion of urea and calcium ions, while improving advective mixing (Fig. 11b). The observed fluid flow behavior is shown in Figure 9. Note that the simulation was carried out in 3D and mesh generated as described in Section 4.2.
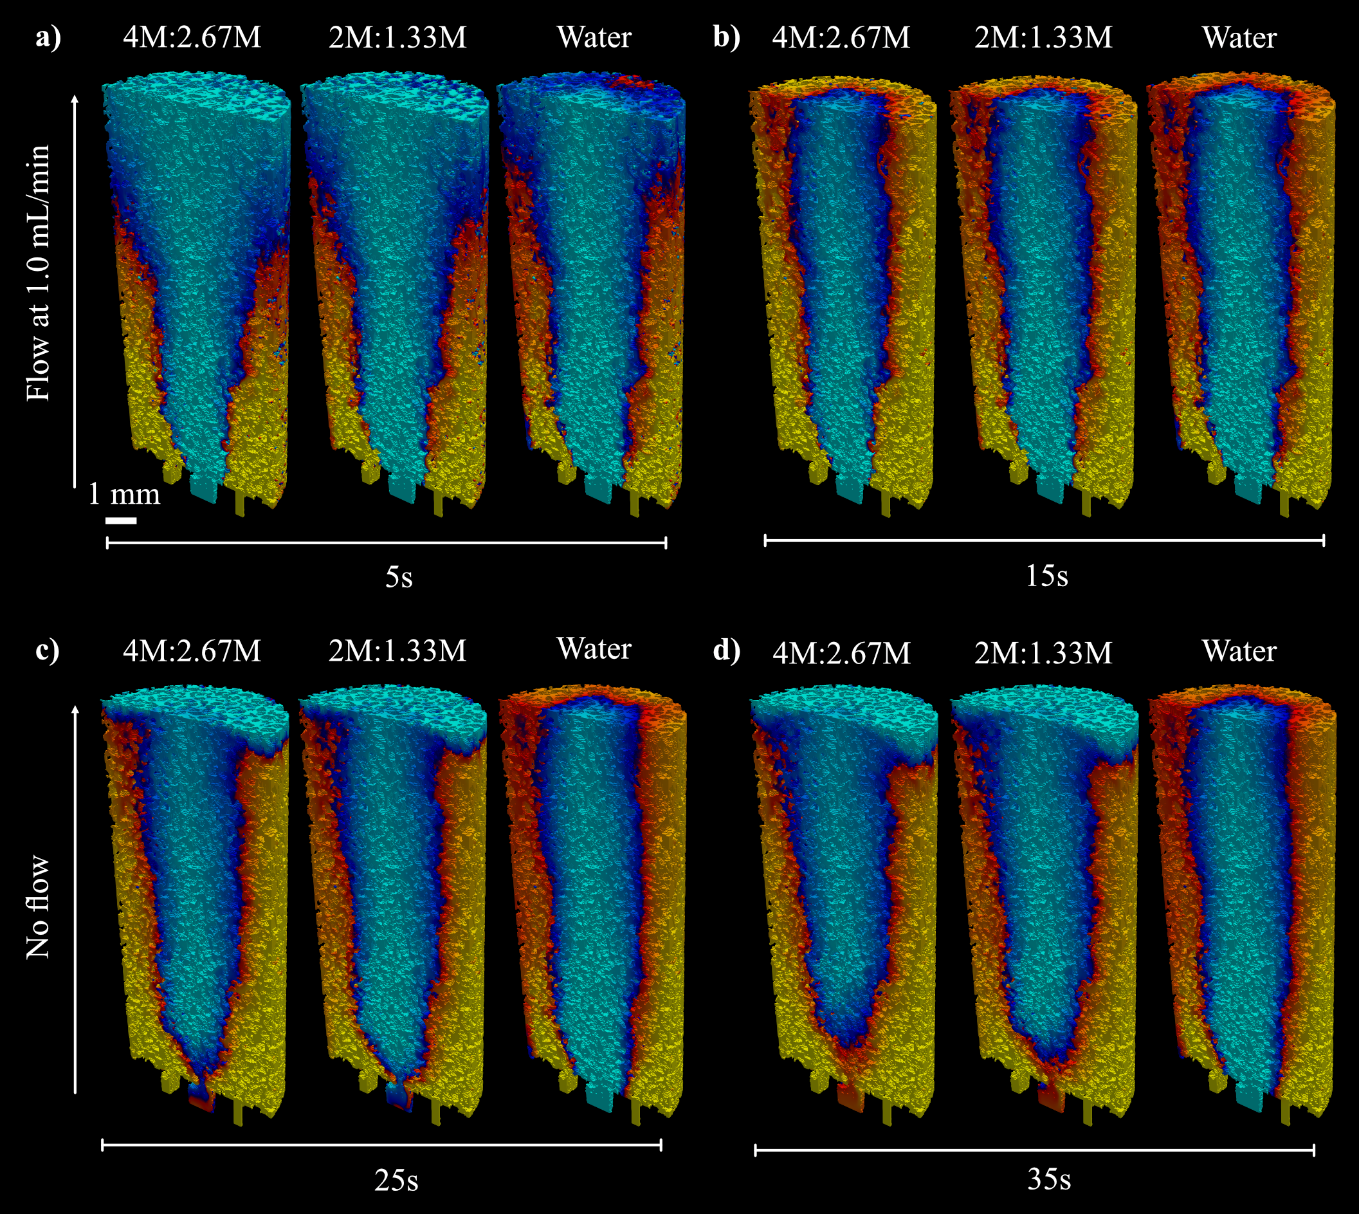
Figure 10: Mixing of fluids under different urea:CaCl2 cementing solution concentrations. a) 5s of flow, b) 15s of flow, c) 10s after flow cessation, d) 20s after flow cessation.
The simulations were repeated to assess if a lower concentration of cementing solution would improve fluid mixing due to a reduced difference in density and viscosity between CS and ES. This entailed adjusting the fluid properties (kinematic viscosity and density) of the CS in the model to correspond with those of a) a 2M urea, 1.33M CaCl2 solution, and b) water. The outcomes of these simulations are shown alongside the initial simulation of the experimental setup in Figure 10.
In the early stages of flow (5s) the breakthrough of CS to the top (outlet) boundary is earlier for water than the more concentrated CS. The injection flow rate is the same in all examples therefore as CS concentration increases, the proportion of the porosity occupied by the CS also does. This is due to the gravitational effect of the denser solution “pooling” towards the inlet boundary during flow and potentially viscous displacement. After 15s, the flow is turned off to simulate the no flow period in which crystals formed. From this point, we observe density driven flow forcing CS downwards into an inverse cone shape. The resultant enzyme field (light blue) closely resembles the geometry of the observed crystallization (Figs. 4-7).
To better quantify these different flow mechanisms, we monitored the standard deviation and mean of the CS field over time to track the evolution of mixing (Fig. 11).
The standard deviation (std_dev) is a measure of the spread from the average CS value. A lower std_dev represents more elements closer to the mean value, and therefore better mixing. The slight drop in std_dev once CS reaches the outlet boundary (3-5s), is due to CS branching radially inwards towards the center of the cylinder (Fig. 10a-b), which encourages better mixing. After this point (~7.5s), the std_dev and mean values stabilize under all CS conditions. When flow is turned off at 15s there is a relatively larger drop in std_dev for run-1 and run-2 than run-3, suggesting that density driven flow is promoting mixing, particularly towards the bottom of the flow cell (Fig. 10d). The inset boxes (Fig. 11b) show that the difference in std_dev between the 4M:2.67M and water cases reduces from 0.0128 at 15s to 0.0091 at 40s.
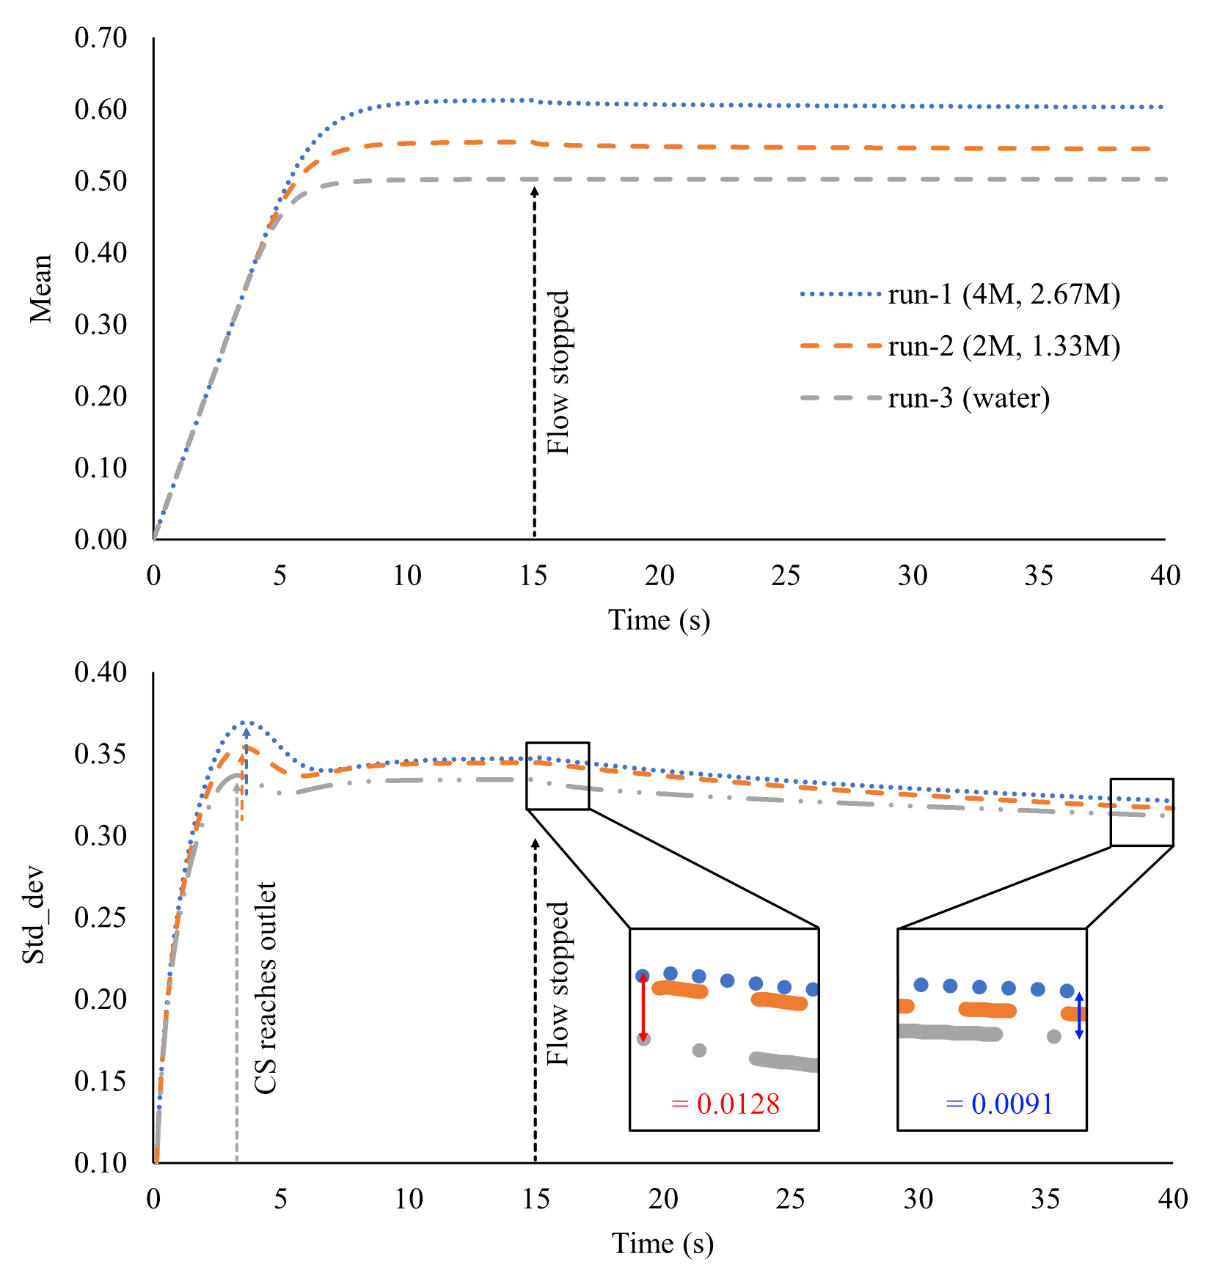
Figure 11: Mixing of fluids under different cementing solution concentrations. Top: Mean CS over time, Bottom: standard deviation over time.
In summary, reducing CS concentration is unlikely to change the observed crystallization geometry (Fig. 10d, 4M:2.67M to 2M:1.33M), but is more likely to reduce the volume of precipitated material through lack of available CO32- and/or Ca2+ ions.
Our finding that crystal growth primarily extends out into open pores rather than concentrating at grain contact points suggests that a larger volume of CaCO3 is required with this EICP injection strategy to achieve a similar reduction in permeability as MICP in a similar porous media and at the same CaCO3 vol% (11). However, permeability reduction following MICP is often due to biomass formation, which is not a permanent plugging agent (18). Further, the urease enzyme is more likely to penetrate smaller pore throats due to its nanoscale proportions (~9 nm) and is therefore more suited for applications in microfractures, and where a greater treatment extent is required, for instance sealing leakage pathways around a CO2 storage injection well.
We have demonstrated that CaCO3 precipitated after a single EICP cycle is sufficient to divert flow during subsequent cycles, thereby shifting precipitation to less well-treated regions. Consequently, we anticipate that precipitation will become more homogeneously distributed in porous media over repeated cycles.
Through targeted mixing across a salt gradient (e.g. by perforating injection casing at different depths and injecting CS through the upper perforation and ES through the lower one), we may be able to create subsurface barriers to flow using the described methods. Mixing solutions directly within the rock rather than in the wellbore, surface, or injection tubing reduces the risk of wellbore scaling and encourages improved penetration of injection solutions into the rock formation. Several single-phase injection strategies that allow mixing of CS and enzyme/bacteria prior to injection have also been explored (5, 7, 30). However, these approaches may face challenges, such as wellbore scaling, unless water is injected between treatment cycles to mitigate this issue. Our findings indicate that density currents, which form once flow is turned off, significantly influence mixing behavior and consequently the location of precipitated CaCO3. While the small simulation volume used in this study is largely affected by the boundary walls of the flow cell, our results align with previous studies on MICP in shallow submerged conditions (13), confirming that density-driven flow controls the location of CaCO3 precipitation. In a future paper, we will investigate larger-scale mixing behavior of the proposed EICP treatment strategy for near-wellbore environments using numerical modelling. We will also compare this with single-phase injection methods to assess their potential for achieving more homogeneous and widespread precipitation. Additionally, future work will consider the impact of varying subsurface conditions such as heterogeneity in permeability, temperature gradients, and varying salinity levels, all of which could further influence the effectiveness of these treatment strategies.
The study investigated the kinetics of enzyme induced CaCO3 formation. High speed XCT imaging allowed quantification of the distribution of CaCO3 precipitates along the diameter and height of the column over time. Computational fluid dynamic modelling from the XCT data enabled qualitative and quantitative analysis of fluid mixing and density driven flow at experimental and theoretical urea/CaCl2 concentrations. The main conclusions of the study are:
Porosity Evolution: More precipitation occurs downstream from the injection point, with limited precipitation in the inlet region due to poor mixing. Precipitates form mainly within the enzyme fluid field rather than in the cementing solution field, showing no obvious relationship with grain contact points. After initial nucleation (within 20 minutes), crystals preferentially grow on existing CaCO3.
Permeability Evolution: Flow simulations indicate that overall permeability reduction is low (-11%) within the full volume. However, in more highly precipitated regions, a 37% reduction is possible within 65 minutes following a single injection cycle. A mostly linear reduction in permeability is observed, closely following the increase in CaCO3 precipitate volume percentage.
Fluid mixing: CFD modelling indicates that the observed crystallization geometry is influenced by density-driven flow once injection ceases. Lower concentrations of urea/CaCl2 are unlikely to alter this observed geometry but may reduce the volume of precipitated material, thereby affecting permeability reduction.
Multiple treatments: While only a single EICP treatment cycle was injected here, the spatial evolution in permeability during that cycle suggests that flow during subsequent cycles would take a different route through the porous media. This could act to localize CaCO3 precipitation in different regions during each cycle with the result that treatment becomes more uniform over time.
In addition to this density driven mixing mechanism, other factors, such as permeability heterogeneity and environmental conditions, are likely to influence treatment effectiveness. These were not explored. Nonetheless, this work highlights the potential of combining high-speed XCT imaging with CFD modelling to improve the understanding and optimization of EICP treatment strategies. These findings have broader implications for environmental and geotechnical applications, including carbon storage, hydraulic control, and ground stabilization. Future studies should scale these methods to larger volumes, directly compare alternative injection strategies, and evaluate the long-term stability of CaCO₃ precipitates under variable environmental conditions.
Supplementary material for this article is available online.
Simulations were performed on the ARCHIE-WeSt High Performance Computer (www.archie-west.ac.uk) based at the University of Strathclyde. The data analysis was supported by NERC NE/T00908X/1 and EPSRC EP/T023198/1, and data acquisition was supported by the NXCT (EP/T02593X) under their FaPOA scheme. PS is supported by the Centre for Doctoral Training (CDT) in Geoscience and the Low Carbon Energy Transition, and KJD was supported by NE/M018687/2.
PS: Conceptualization, Methodology, Analysis, lead on all stages of MS preparation. JM: Funding, Data Acquisition, Supervision, Modelling, MS preparation. JW: Data acquisition, MS review. KD: Project design & funding, Analysis, Supervision, MS preparation.
The authors have no conflicts of interest to declare.
The data and analysis supporting the findings of this study are available from DOI: 10.5281/zenodo.14246214 https://doi.org/10.5281/zenodo.14246214
Philip J. Salter https://orcid.org/0009-0005-0731-5077
James M. Minto https://orcid.org/0000-0002-9414-4157
Jay Warnett https://orcid.org/0000-0003-2284-790X
Katherine J. Dobson https://orcid.org/0000-0003-2272-626X
Baum, D., Weaver, J., Zlotnikov, I., Knötel, D., Tomholt, L., Dean, M. (2019). High-Throughput Segmentation of Tiled Biological Structures using Random Walk Distance Transforms. Integrative and comparative biology, 59, 6. https://doi.org/10.1093/icb/icz117
Bernard, D., Guillon, O., Plougonven, E., & Combaret, N. (2011). Constrained sintering of glass films: Microstructure evolution assessed by synchrotron computed tomography. Acta Materialia, vol. 59, 6228-6238 https://doi.org/10.1016/j.actamat.2011.06.022
Carmona, J. P. S. F., Oliveira, P. J. V. & Lemos, L. J. L. (2016). Biostabilization of a Sandy Soil Using Enzymatic Calcium Carbonate Precipitation. Procedia Engineering, 143, 1301-1308. https://doi.org/10.1016/j.proeng.2016.06.144
Chedburn, L., Underhill, J. R., Head, S. & Jamieson, R. (2022). The critical evaluation of carbon dioxide subsurface storage sites: Geological challenges in the depleted fields of Liverpool Bay. AAPG Bulletin, 106, 1753-1789. https://doi.org/10.1306/07062221120
Cheng, L., Shahin, M. A. & Chu, J. (2018). Soil bio-cementation using a new one-phase low-pH injection method. Acta Geotechnica, 14, 615-626. https://doi.org/10.1007/s11440-018-0738-2
Chunxiang, Q., Jianyun, W., Ruixing, W., Liang, C. (2009). Corrosion protection of cement based building materials by surface deposition of CaCO3 by Bacillus pasteurii. Materials Science and Engineering: C, 29 (4), 1273–1280. https://doi.org/10.1016/j.msec.2008.10.025
Cui, M.-J., Lai, H.-J., Hoang, T. & Chu, J. (2020). One-phase-low-pH enzyme induced carbonate precipitation (EICP) method for soil improvement. Acta Geotechnica, 16, 481-489. https://doi.org/10.1007/s11440-020-01043-2
Dobson, K. J., Coban, S. B., McDonald, S. A., Walsh, J. N., Atwood, R. C. & Withers, P. J. (2016). 4-D imaging of sub-second dynamics in pore-scale processes using real-time synchrotron X-ray tomography. Solid Earth, 7, 1059-1073. https://doi.org/10.5194/se-7-1059-2016
Godinho, Ma, Chai, Storm & Burnett. (2019). Mineral Precipitation in Fractures and Nanopores within Shale Imaged Using Time-Lapse X-ray Tomography. Minerals, 9(8), 480. https://doi.org/10.3390/min9080480
Kim, D. H., Mahabadi, N., Jang, J. & Paassen, L. A. (2020). Assessing the Kinetics and Pore‐Scale Characteristics of Biological Calcium Carbonate Precipitation in Porous Media using a Microfluidic Chip Experiment. Water Resources Research, 56. https://doi.org/10.1029/2019WR025420
Konstantinou, C., Wang, Y., & Biscontin, G. (2023). A Systematic Study on the Influence of Grain Characteristics on Hydraulic and Mechanical Performance of MICP-Treated Porous Media. Transport in Porous Media, 147(2), 305-330. https://doi.org/10.1007/s11242-023-01909-5
Krevor, S., De Coninck, H., Gasda, S. E., Ghaleigh, N. S., De Gooyert, V., et al. (2023). Subsurface carbon dioxide and hydrogen storage for a sustainable energy future. Nature Reviews Earth & Environment, 4, 102-118. https://doi.org/10.1038/s43017-022-00376-8
Li, X., Tao, J. & van Paassen, L.A. (2024). Reactive transport modeling of microbial-induced calcite precipitation treatment through shallow underwater injection. Computers and Geotechnics, 174, 106601. https://doi.org/10.1016/j.compgeo.2024.106601
Lin, Q., Neethling, S. J., Dobson, K. J., Courtois, L. & Lee, P. D. (2015). Quantifying and minimising systematic and random errors in X-ray micro-tomography based volume measurements. Computers & Geosciences, 77, 1-7. https://doi.org/10.1016/j.cageo.2014.12.008
Menke, H. P., Reynolds, C. A., Andrew, M. G., Pereira Nunes, J. P., Bijeljic, B. & Blunt, M. J. (2018). 4D multi-scale imaging of reactive flow in carbonates: Assessing the impact of heterogeneity on dissolution regimes using streamlines at multiple length scales. Chemical Geology, 481, 27-37. https://doi.org/10.1016/j.chemgeo.2018.01.016
Minto, J. M., Hingerl, F. F., Benson, S. M. & Lunn, R. J. (2017). X-ray CT and multiphase flow characterization of a ‘bio-grouted’ sandstone core: The effect of dissolution on seal longevity. International Journal of Greenhouse Gas Control, 64, 152-162. https://doi.org/10.1016/j.ijggc.2017.07.007
Nemati, M. & G. Voordouw. (2003). Modification of porous media permeability, using calcium carbonate produced enzymatically in situ. Enzyme and Microbial Technology, 33, 635-642. https://doi.org/10.1016/S0141-0229(03)00191-1
Nemati, M., Greene, E. A. & Voordouw, G. (2005). Permeability profile modification using bacterially formed calcium carbonate: comparison with enzymic option. Process Biochemistry, 40, 925-933. https://doi.org/10.1016/j.procbio.2004.02.019
Otsu, N. (1979). A thresholding selection method from grayscale histogram. IEEE Transactions on Systems, Man, and Cybernetics, 9(1), 62-66. https://doi.org/10.1109/TSMC.1979.4310076
Peng, S., Di, H., Fan, L., Fan, W., & Qin, L. (2020). Factors Affecting Permeability Reduction of MICP for Fractured Rock. Frontiers in Earth Science, 8. https://doi.org/10.3389/feart.2020.00217
Putra, H., Yasuhara, H., Kinoshita, N., Neupane, D. & Lu, C. W. (2016). Effect of Magnesium as Substitute Material in Enzyme-Mediated Calcite Precipitation for Soil-Improvement Technique. Frontiers in Bioengineering and Biotechnology, 4, 37. http://dx.doi.org/10.3389/fbioe.2016.00037
Putra, H., Yasuhara, H., Kinoshita, N., Erizal & Sudibyo, T. (2018). Improving Shear Strength Parameters of Sandy Soil using Enzyme-Mediated Calcite Precipitation Technique. Civil Engineering Dimension, 20, 91-95. https://doi.org/10.9744/ced.20.2.91-95
Ringrose, P. S. & Meckel, T. A. (2019). Maturing global CO2 storage resources on offshore continental margins to achieve 2DS emissions reductions. Scientific Reports, 9, 17944. https://doi.org/10.1038/s41598-019-54363-z
Schindelin, J., Arganda-Carreras, I., Frise, E., Kaynig, V., Longair, M., et al. (2012). Fiji: an open-source platform for biological-image analysis. Nature Methods, 9, 676-682. https://doi.org/10.1038/nmeth.2019
Singh, A., Paramkusam, B. R. & Maiti, P. R. (2021). Cyclic degradation and pore pressure dynamics of EICP treated hydrocarbon contaminated sands. Soil Dynamics and Earthquake Engineering, 140, 106369. https://doi.org/10.1016/j.soildyn.2020.106369
Studholme, C., Hill, D. L. G., Hawkes, D. J. (1999). An overlap invariant entropy measure of 3D medical image alignment. Pattern Recognition, Volume 32, Issue 1, 71-86. https://doi.org/10.1016/S0031-3203(98)00091-0
Wang, H., Sun, X., Miao, L., Cao, Z., Fan, G. & Wu, L. (2022). Induced CaCO3 mineral formation based on enzymatical calcification for bioremediation under different pressure conditions. Journal of Petroleum Science and Engineering, 216, 110787. https://doi.org/10.1016/j.petrol.2022.110787
Weinhardt, F., Class, H., Dastjerdi, S. V., Karadimitriou, N., Lee, D., Steeb, H. (2021). Experimental Methods and Imaging for Enzymatically Induced Calcite Precipitation in a Microfluidic Cell. Water Resources Research. 57, 3, e2020WR029361. https://doi.org/10.1029/2020WR029361
Willems, C. J. L., Cheng, C., Watson, S. M., Minto, J., Williams, A., et al. (2021). Permeability and Mineralogy of the Újfalu Formation, Hungary, from Production Tests and Experimental Rock Characterization: Implications for Geothermal Heat Projects. Energies, 14, 4332. https://doi.org/10.3390/en14144332
Yang, Y., Chu, J., Liu, H. & Cheng, L. (2023). Improvement of uniformity of biocemented sand column using CH3COOH-buffered one-phase-low-pH injection method. Acta Geotechnica, 18, 413–428. https://doi.org/10.1007/s11440-022-01576-8
Yasuhara, H., Neupane, D., Hayashi, K., and Okamura, M. (2012). Experiments and predictions of physical properties of sand cemented by enzymatically-induced carbonate precipitation. Soils and Foundations, 52, 539–549. http://dx.doi.org/10.1016/j.sandf.2012.05.011